
My project for the course: Data Visualization, Design Infographics in Adobe Illustrator
The Program Included 3 hours of content, and I was able to finish it in a few sittings. This was a challenging and rewarding course that helped me improve my visualization skills in data analysis.
The dataset was: Internet Companies of 2020, and from the additional datasets given, I picked "The 50 Most Profitable Internet Companies Ranked by Visitors
", and sampled only the first 10, to make the project less complex.
From that I produced
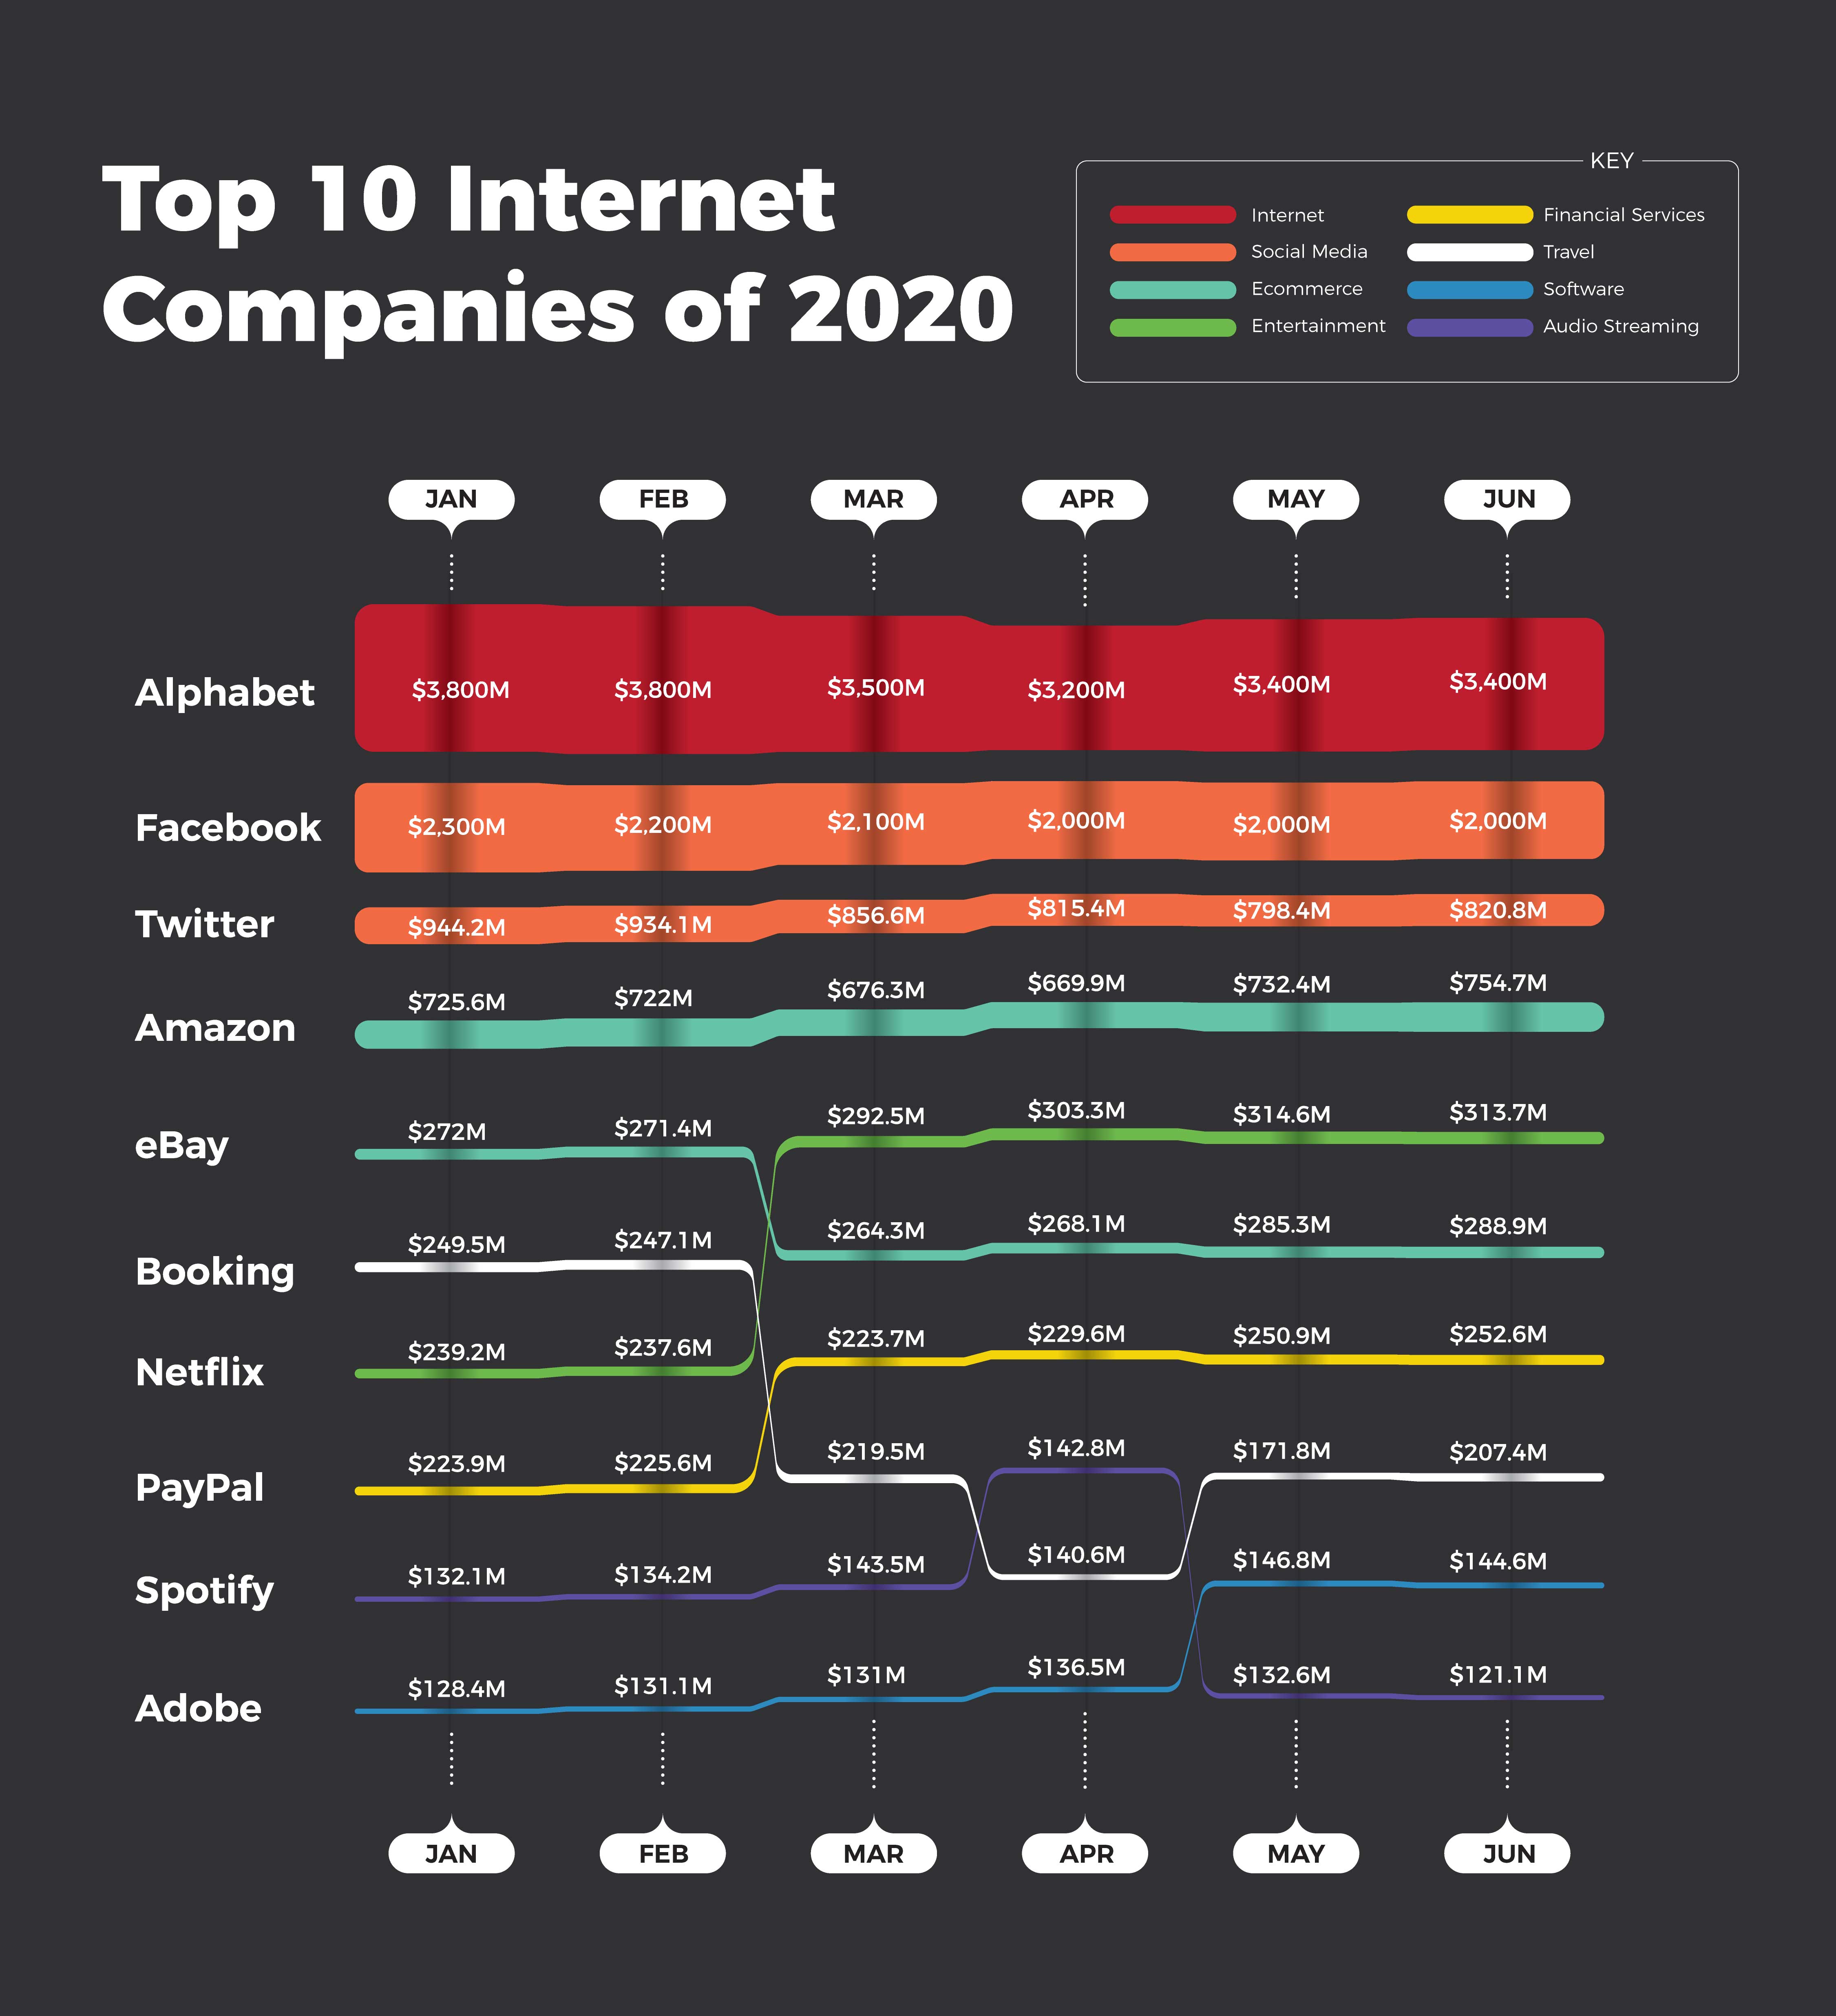
the graph below:
Challenges Faced
You might have noticed some discrepacies between the values and their position value on the graph. well that is just one of the challenges I faced during the project.
- The revenue values for Spotify and Adobe for March and April do not make sense, maybe because of the alignment of the tabs before expanding and joining (may have other errors too...only noticed those after I was done. lol)
- When entering the values from Spreadsheet to Illustrator table values, there are some missing values. That is easily fixed by removing commas in the value so that illustrator reads them as numbers and not text :- ) (I found that out the hard way)
Used their brand colors for easy contrast.
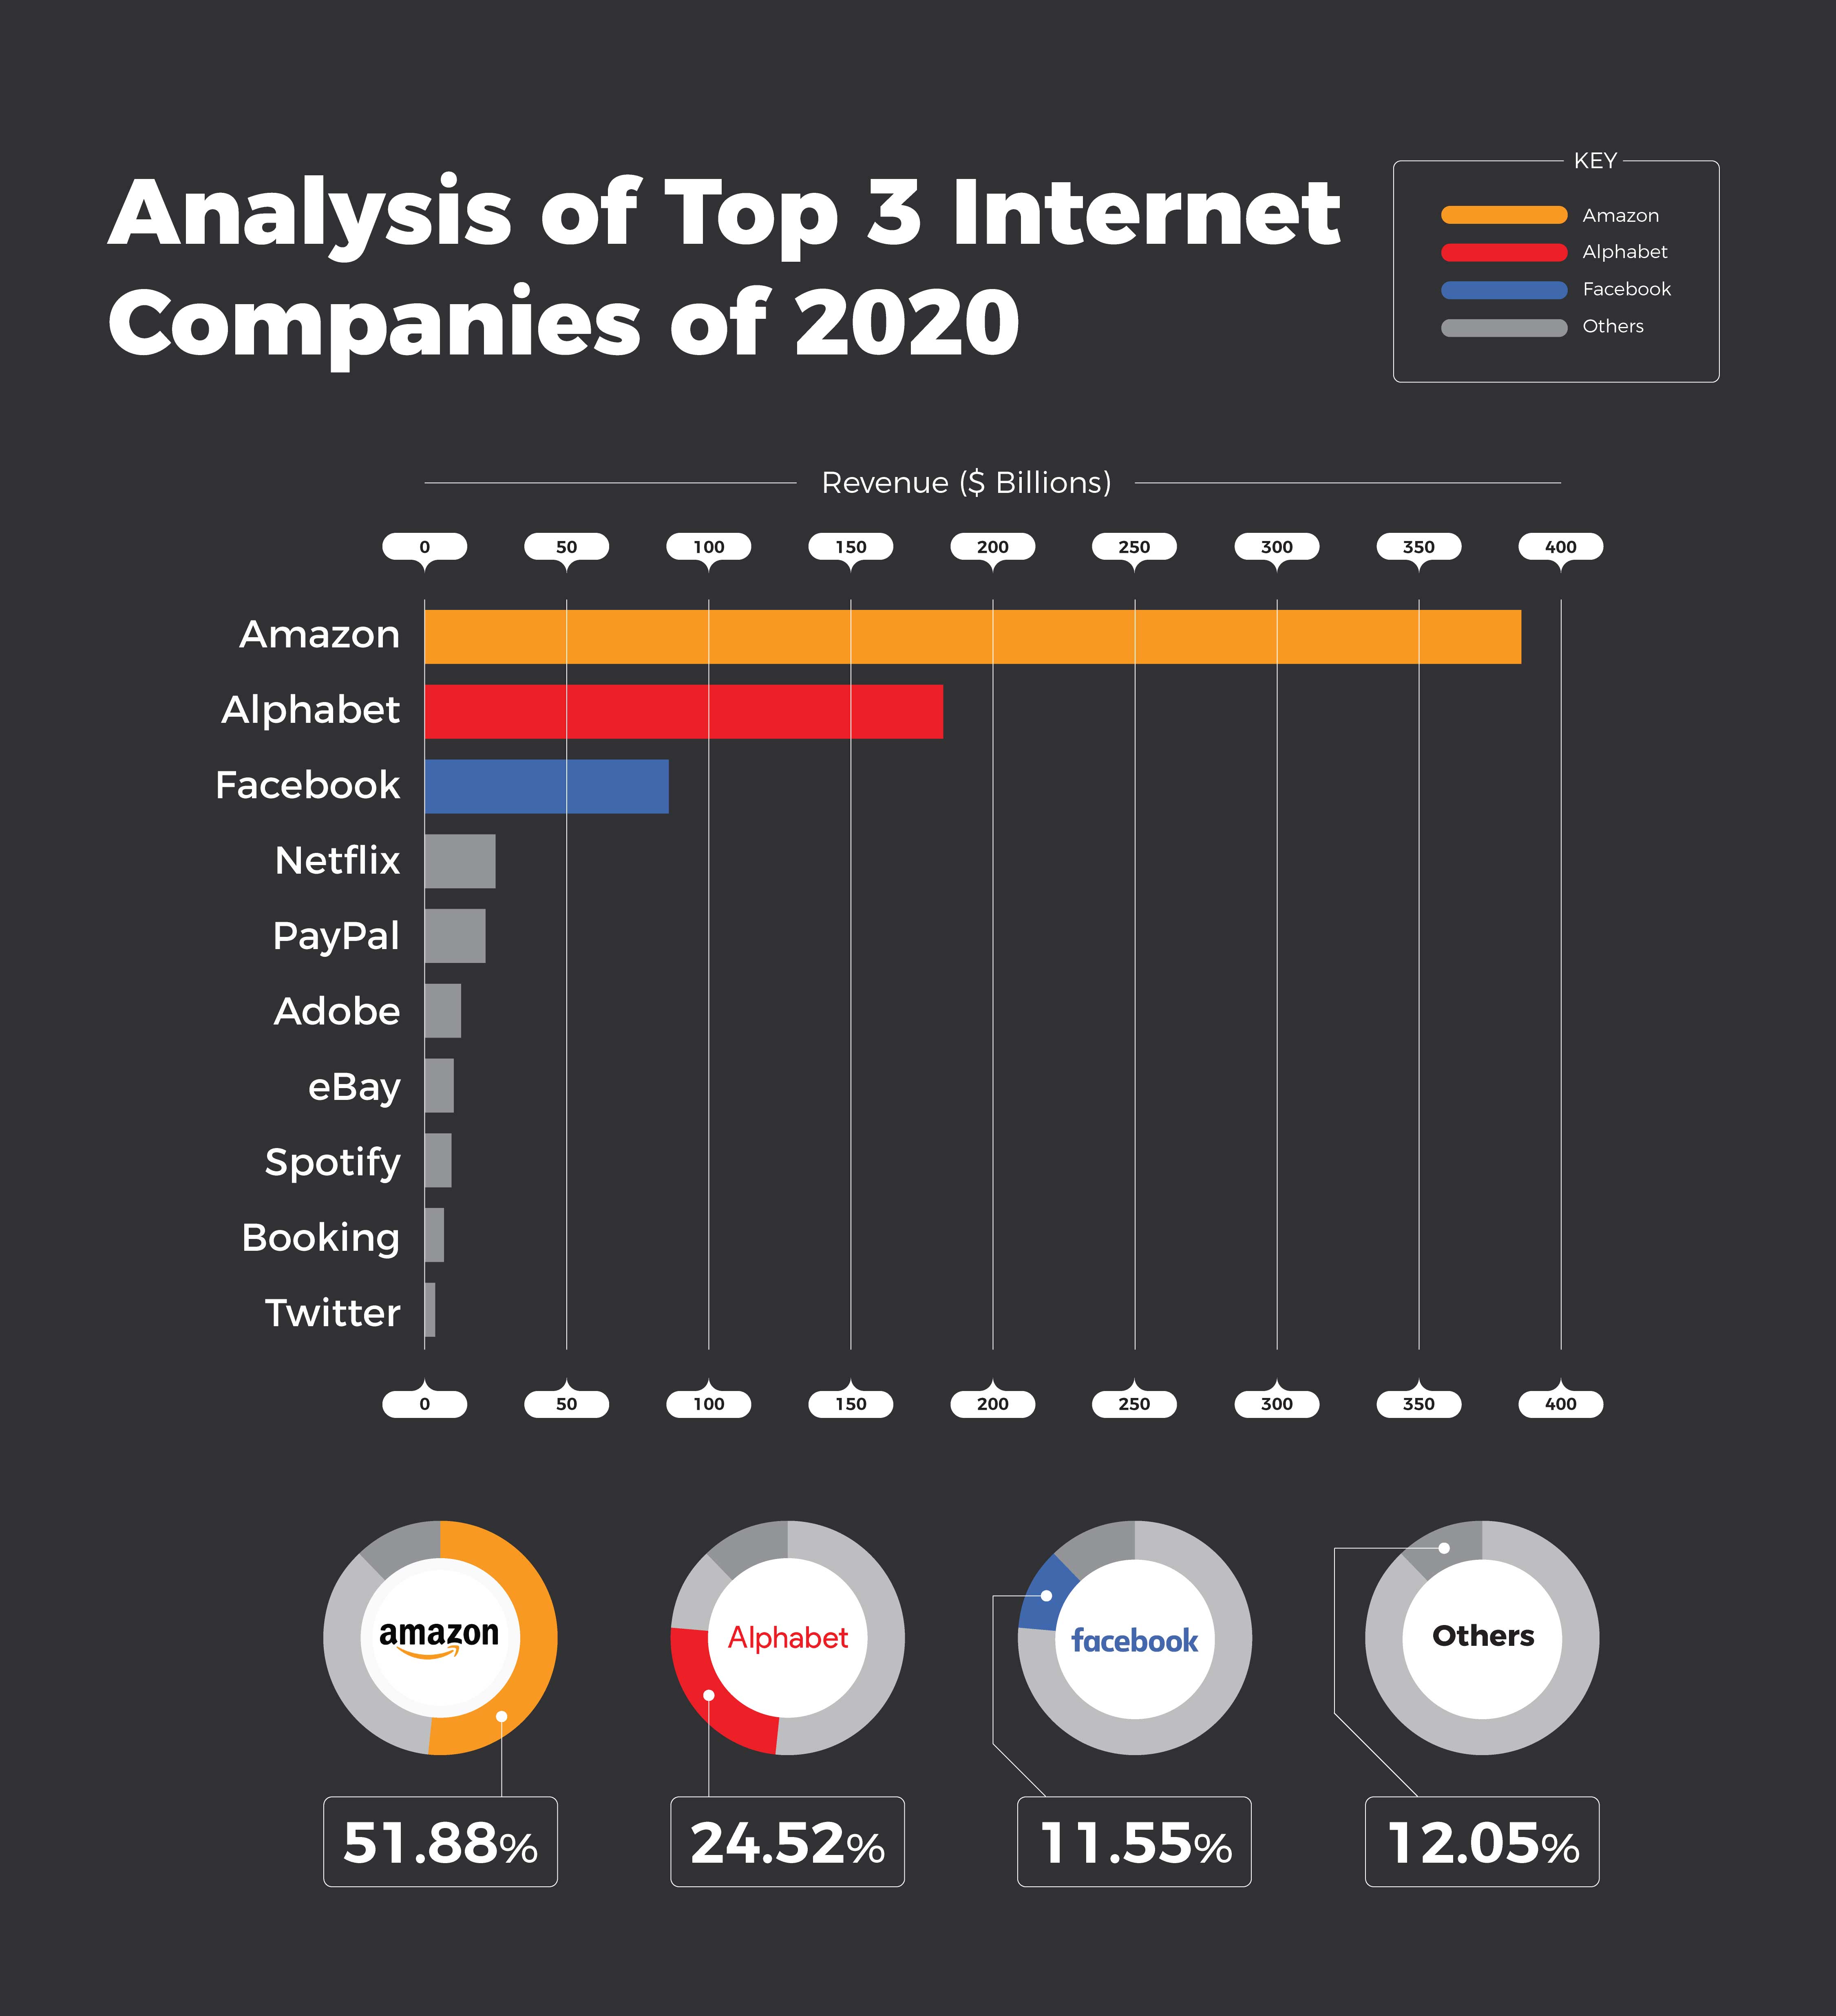
Cumulatively, the top 3 (Three) companies take up 87.95% of the summed up revenue for all the 10 companies, compared to the remaining 12.05% shared by the remaining 7 (Seven) companies.
Conclusion
Further analysis can be made on the sampled 10 companies using the other columns in the given dataset: Industry Type, Total Number of Visitors and Visitors per second.
Let's Connect!
Thank you for checking out my portfolio! I hope you enjoyed exploring my projects. You can also explore more of my data visualizations on Tableau Public. Feel free to view some of my brand identity development projects on Behance.
Tikhala :-)