
H.R. Department Employee Distribution Report
A Data-Driven Insights Dashboard developed for Human Resource Department. This project is an analysis of relevant personnel data, displayed to help see trends, patterns, and areas that need work.
Employee data: 22,000 rows of data from the year 2000 to 2020. First the data was loaded into MySQL Database, and worked on using MySQL Workbench. The questions of the analysis were answered by generating SQL Queries, exported as tables and visualized using Microsoft Power BI.
The data cleaning SQL script:
    create database projects;
    use projects;
    -- Preview of  the avaliable dataset to be used for the project
    select * from hr;

    -- change column name as there was an error with the imported data
    -- employee id column given a proper name and data type
    alter table hr
    change column id emp_id varchar(20) null;

    -- change the data type for the columns that carry
    -- date values (Data Type from string to date)
    describe hr;
    select birthdate from hr;

    -- enablinng safe updates for sql
    set sql_safe_updates = 0;


    -- setting "birthdate" to date format from string
    update hr
    set birthdate = case
        when birthdate like '%/%' then
        date_format(str_to_date(birthdate, '%m/%d/%Y'), '%Y-%m-%d')
        when birthdate like '%-%' then
        date_format(str_to_date(birthdate, '%m-%d-%Y'), '%Y-%m-%d')
        else null
        end;

    alter table hr
    modify column birthdate date;

    select hire_date from hr;

    update hr
    set hire_date = case
        when hire_date like '%/%' then
        date_format(str_to_date(hire_date, '%m/%d/%Y'), '%Y-%m-%d')
        when hire_date like '%-%' then
        date_format(str_to_date(hire_date, '%m-%d-%Y'), '%Y-%m-%d')
        else null
        end;

    -- changing the hire_date column data type to date
    alter table hr
    modify column hire_date date;

    update hr
    set termdate = date(str_to_date(termdate, '%Y-%m-%d %H:%i:%s UTC'))
    where termdate is not null and termdate != '';

    select termdate from hr;

    -- setting the sql mode to be able to get output of "0000-00-00"
    -- for all null date values, this is important because age
    -- and or years will need to be calculated and
    -- subtraction can not be done with null values
    set sql_mode = '';
    set global sql_mode = '';

    alter table hr
    modify column termdate date;

    select birthdate, hire_date, termdate
    from hr;

    -- adding an age column to our data set, by subtracting the birthdate
    -- from the current date of the dataset analysis

    alter table hr add column age int;
    update hr

    set age = timestampdiff(year, birthdate, curdate());
    select birthdate, age from hr;

    -- preview of the age range of the dataset (viewing the min and max age)
    select
        min(age) as youngest,
        max(age) as oldest
    from hr;

    -- Assuming min legal age for workers is 18 years,
    -- explored futher into how many attributes were below age
    select count(*)
    from hr
    where age < 18;

    -- dropping all the attributes with age below 18
    -- (967 Values of the 22,000+ total values)
    delete from hr
    where age < 18;
Data Exploration using SQL:
Questions to be answered in the analysis
- What is the Gender breakdown of employees in the company?
- What is the race/ethinicity breakdown of employees in the company?
- What is the age distribution of employees in the company?
- How many employees work at headqaters versus remote locations?
- Find the average tenure in years
- How does the gender distribution vary across departments and job titles?
- What is the gender distribution of job titles across the company?
- Which department has the highest turnover rate?
- What is the distribution of employees by location: city and state?
- How has the employee count changed over time based on hire and termination date?
- What is the tenure distribution for each department?
    -- 1. What is the Gender breakdown of employees in the company?
    select gender, count(*) as count
    from hr
    where termdate = '0000-00-00'
    group by gender;

    -- 2. What is the race/ethinicity breakdown of employees in the company?
    select race, count(*) as race_count
    from hr
    where termdate = '0000-00-00'
    group by race
    order by race_count desc;

    -- 3. What is the age distribution of employees?
    select
        case
        when age >=18 and age <= 24 then '18-24'
        when age >=25 and age <= 34 then '35-44'
        when age >=45 and age <= 54 then '45-54'
        when age >=55 and age <= 64 then '55-64'
        else '64+'
        end as age_bins, gender,
    count(*) as count
    from hr
    where termdate = '0000-00-00'
    group by age_bins, gender
    order by gender;

    -- 4. How many employees work at headquaters versus remote locations?
    select location, count(*) as count
    from hr
    where termdate = '0000-00-00'
    group by location;

    -- 5. Find the average tenure in years
    select
        round (avg (datediff(termdate, hire_date))/365,2) as avg_tenure
        from hr
        where termdate <= curdate() and termdate <> '0000-00-00';

    -- 6. How  does the gender distribution vary across departments and job titles?
    select department, gender, count(*) as count
    from hr
    where termdate = '0000-00-00'
    group by department, gender
    order by department;

    -- 7. What is the gender distribution of job titles across the company?
    select jobtitle, gender, count(*) as count
    from hr
    where termdate = '0000-00-00'
    group by jobtitle, gender
    order by jobtitle;

    -- 8. Which department has the highest turnover rate?
    select department,
        total_count,
        terminated_count,
        terminated_count/total_count as termination_rate
        from(
            select department,
                count(*) as total_count,
                sum(case when termdate<>'0000-00-00' and
                termdate <= curdate() then 1
                    else 0 end) as terminated_count
                from hr
                group by department
        ) as subquery
        order by termination_rate desc;

    -- 9. What is the distribution of employees by location?
    select location_state, count(*) as count
    from hr
    where termdate = '0000-00-00'
    group by location_state
    order by count desc;

    -- 10. How has the employee count changed over time?
    -- based on hire, and termination dates?
    select
        year,
        hires
        terminations,
        hires - terminations as net_change,
        round ((hires - terminations)/hires * 100,2) as net_change_percent
    from (
        select
            year(hire_date) as year,
            count(*) as hires,
            sum(case
                when termdate <> '0000-00-00' and termdate <= curdate() then 1
                else 0
                end
            ) as terminations

            from hr
            group by year(hire_date)
                ) as subquery
                order by year asc;

    -- 11. What is the tenure distribution for each department?
    select department, round(avg(datediff(termdate, hire_date)/365),0)
    as average_tenure
    from hr
    where termdate <= curdate() and termdate <> '0000-00-00'
    group by department;
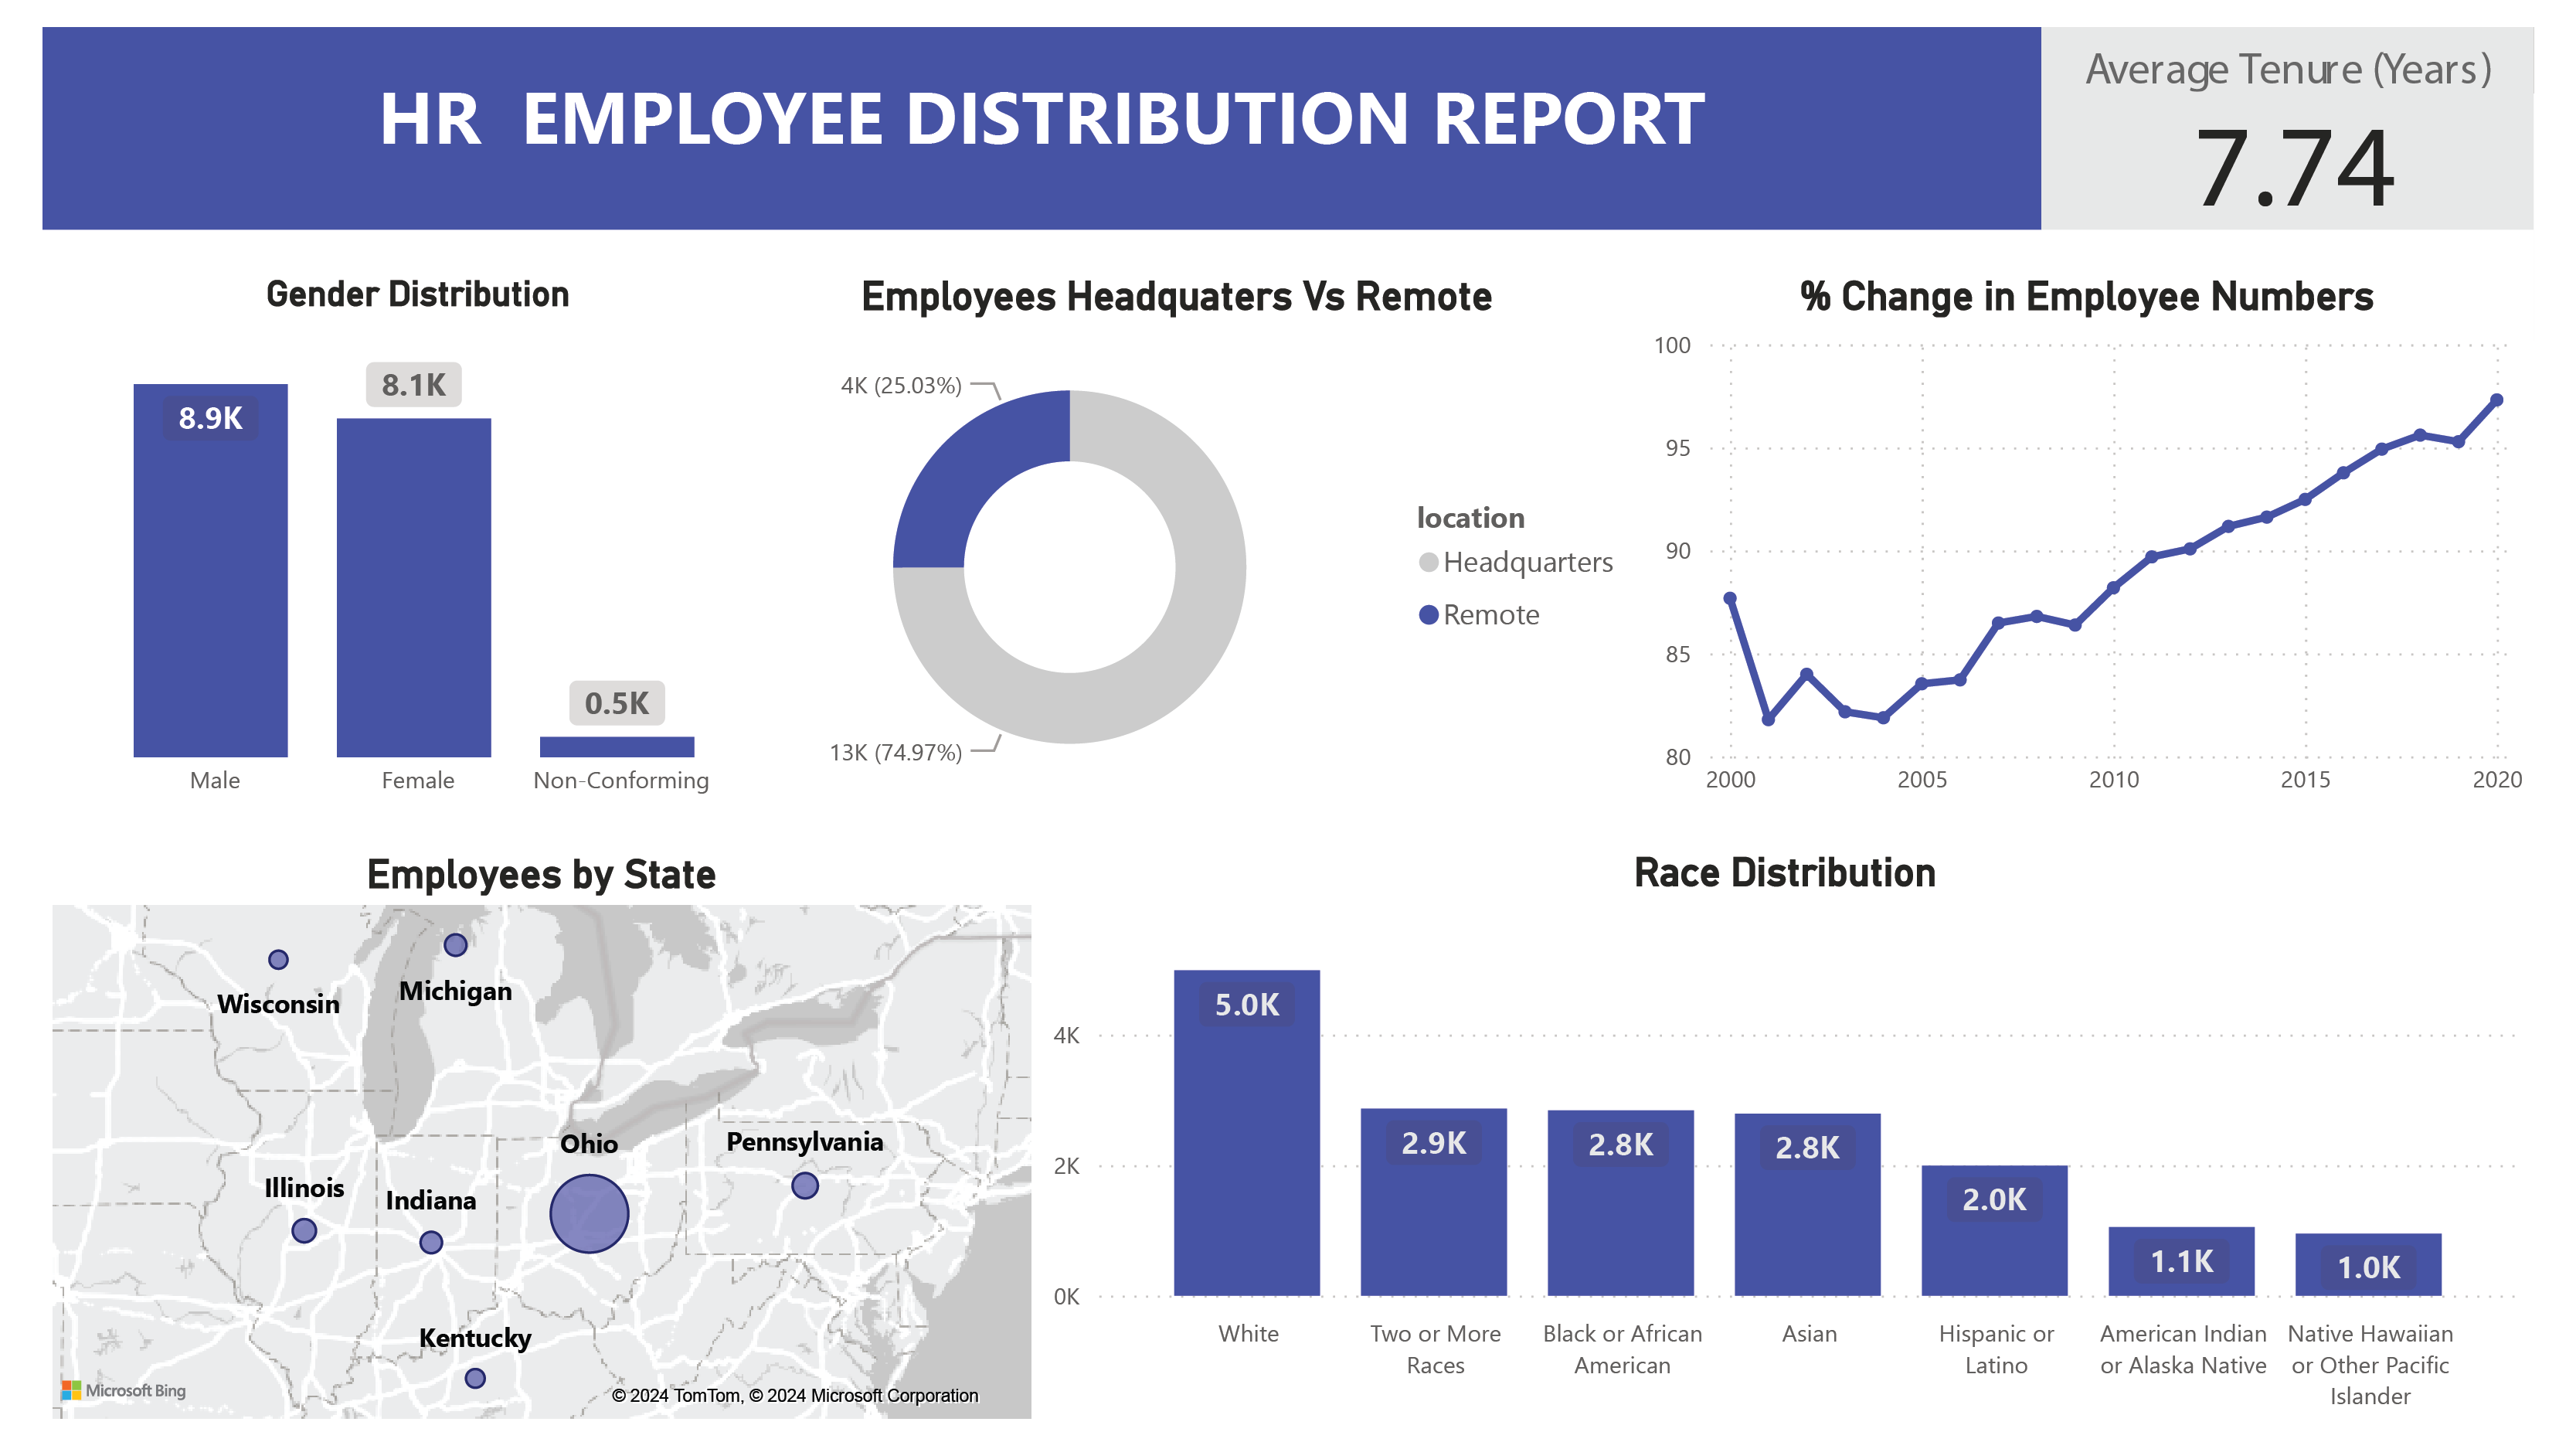
Power BI Report Page 1
Showing the Report Title, Average Tenure as a Data Card. A visualization showing the gender distribution within the company. A doughnut chart showing the number of remote, 25.03%, and non remote workers, 74.97%. A line chart showing the percentage change in the number of Employees in the company. A map showing the distribution of the employees by location, and the Employee distribution by race, with Whites holding the majority.
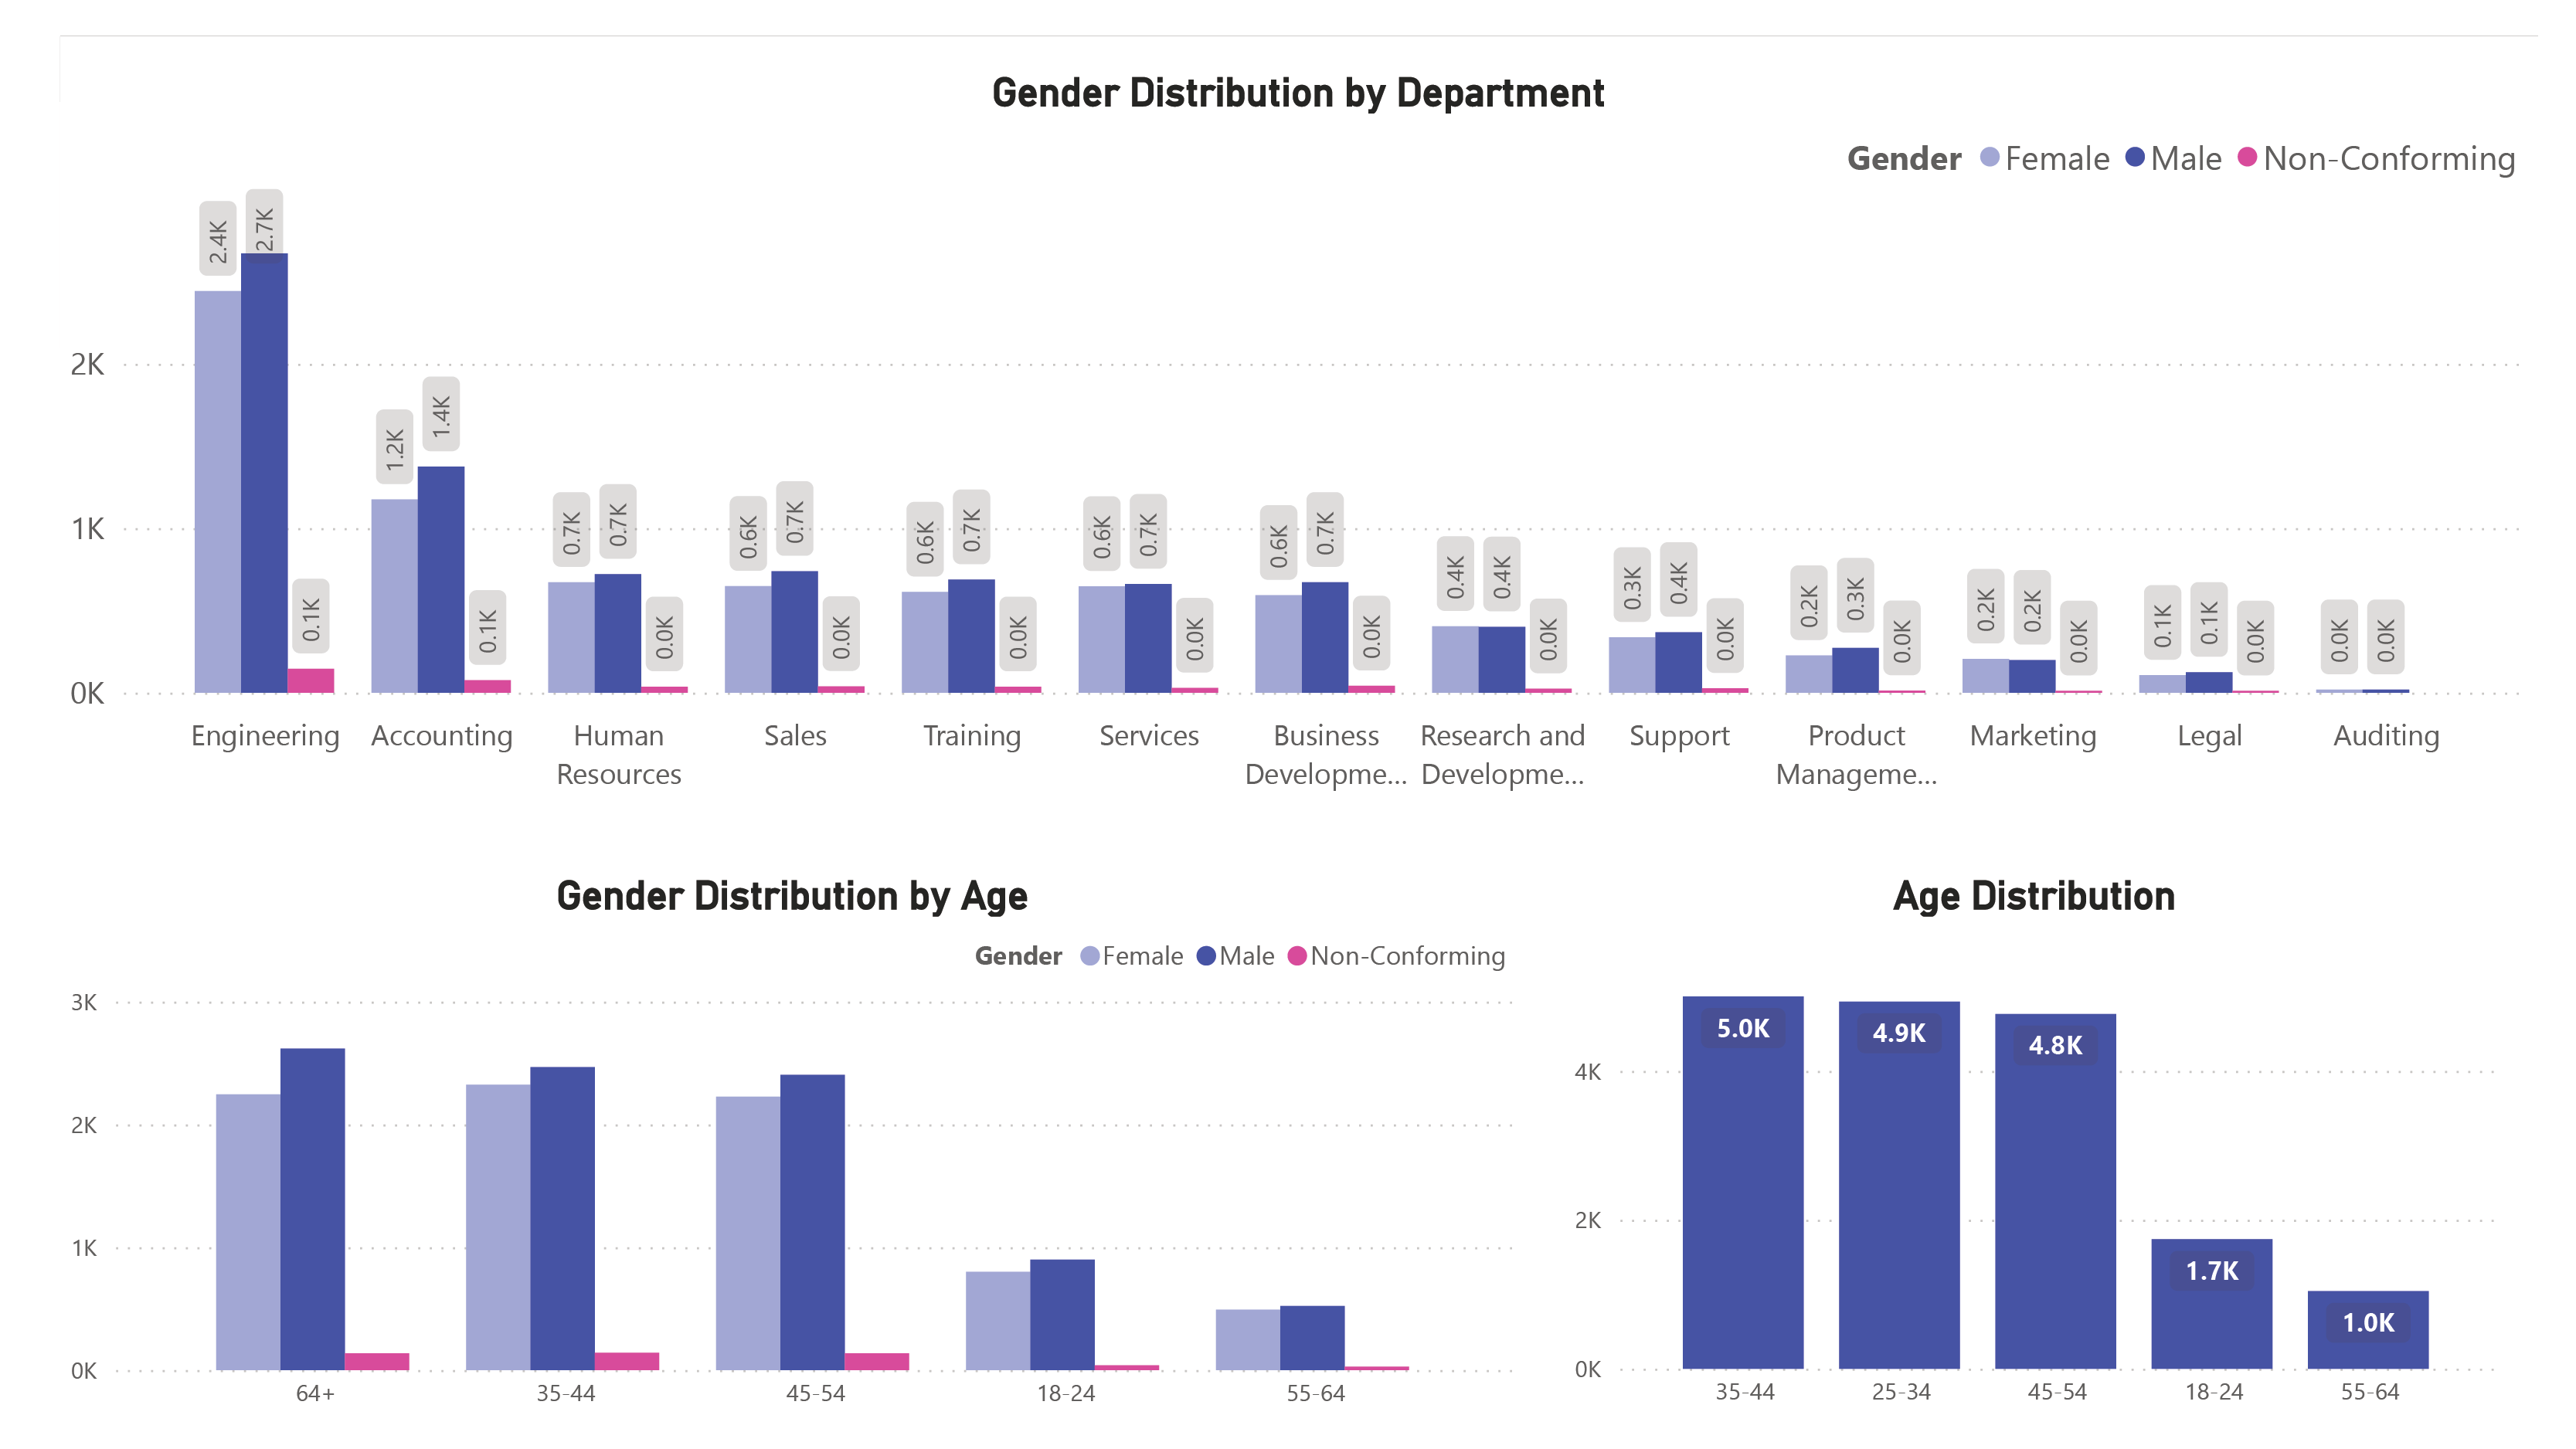
Power BI Report Page 2
Visualisation of how the three genders: Male, Female, and Non-Conforming, are distributed by department. The Genders are generally fairly distributed and males are more compared o females in all departments. Age distribution across the five age bins.
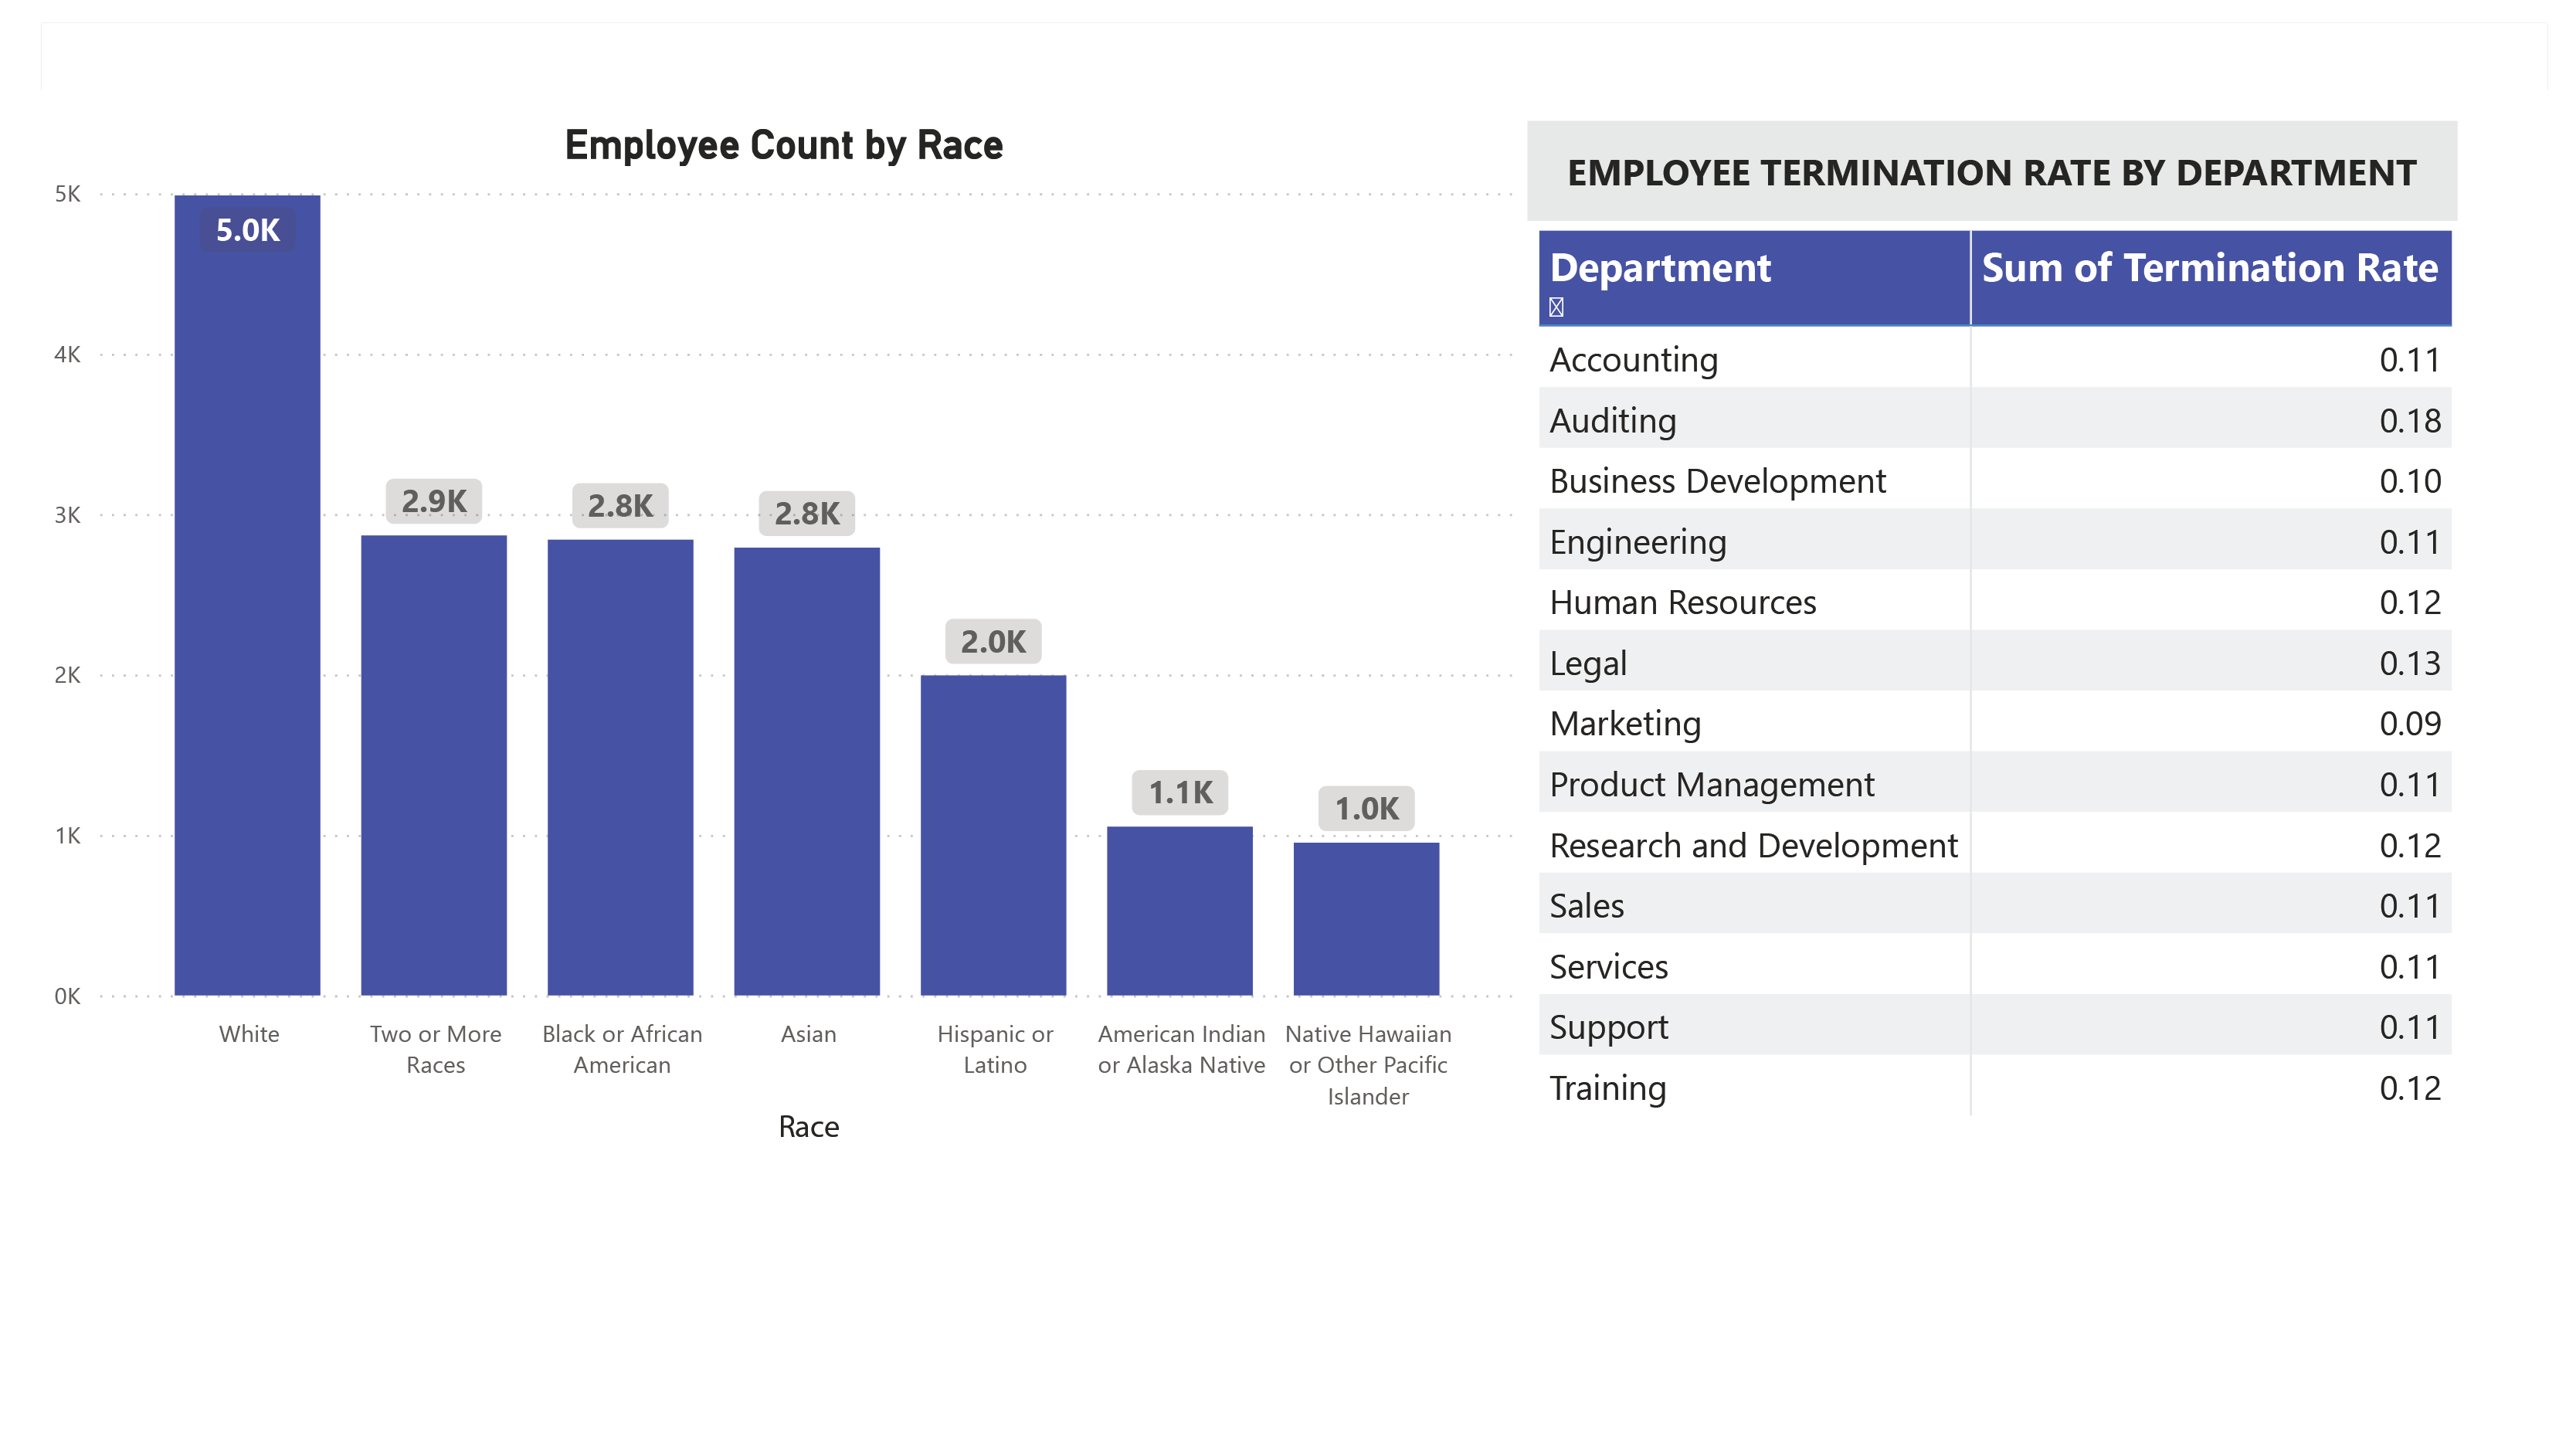
Power BI Report Page 3
A visualisation os the Employee Count by race, and the termination rate by department in a table visual.
Summary of Findings
- There are more male employees compared to females.
- White race is the most dominant while Native Hawaians and American Indians are the least dominant.
- The youngest employee is 20 years old and the oldest is 59 years old.
- Age bins were created for the analaysis (18-24,25-34,35-44,45-54,55-64). The age bin 25-34 has the largest number of employees, followed by 35-44, while the smallest group was 55-64 age bin.
- A majority of employees work at the headquaters compared to the number of employees who work remotely.
- The average tenure in this company is 7 years.
- The gender distribution across departments is fairly balanced, but there are generally more males compared to the number of females in eact department.
- The marketing department has the highest turnover rate, followed by Training Department. The least turnover rate are thr REsearch and Development, Support and Legal Departments.
- A large number of employees come from the state of Ohio.
- The net change in employees has increased over the years.
- The average tenure for each department is about 8 years, with the Legal and Auditing Departments having the highest. Services, Sales and MArketing Departments have the lowest tenure at department level.
Limitations
- Some records (967) were dropped after makingt the assumption that the legal working age was 18 years old. It is to be noted that the 967 dropped rows also contained some negative values, (Age column generated from the difference of Birthdate and Current date), which meant there were errors in date values of some rows.
- Some termination dates were too far off into the future, and therefore were not included in the analysis (1599 rows). The only termination dates used were those less than or equal to the current date.
- The gender value: Unclassified, may have altered the gender distribution because some males or females may have chosen not to state thier gender thereby altering the true gender distribution of the data.
Let's Connect!
Thank you for checking out my portfolio! I hope you enjoyed exploring my projects. You can also explore more of my data visualizations on Tableau Public. Feel free to view some of my brand identity development projects on Behance.
Tikhala :-)